Atterberg Limits
View Options
When selecting the Atterberg Limits column from the column types, the following View Options window arises.
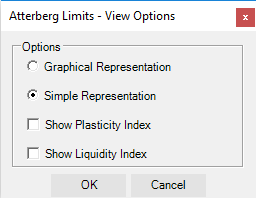
The user has two options regarding the column representation and those are to be either Graphical or Simple. If the Show Plasticity/Liquidity Index boxes are marked, then these parameters will be visible to the log as well.
In case of Graphical Representation there is only the choice of the Plasticity Index to be shown.
Editing Options
When editing the attributes of the Atterberg Limits column it is important for the user to be aware of the following:
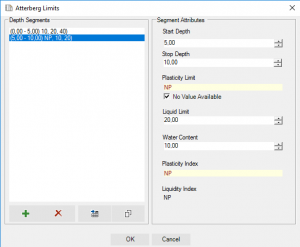
- Data can be inserted/edited either by following the basic steps, or by using the grid table (see figure below). Besides typing the values, the user has the option to paste values from a table (table formatting must be consistent with the expected data and no empty cells are permitted / cells with no value must have the value 0) when using the grid table. Warnings regarding the right insertion of depth segments are shown when needed.
- The Liquidity and Plasticity Index are auto calculated attributes (PI = LL-PL , LI = (WC-PL) / PI). The Liquidity Index is not editable compared to the Plasticity Index.
- If the conducted test leads to Non Plastic (NP) sample, the No Value Available box must be marked.
Consolidation Tests
View Options
When selecting the Consolidation Test column from the column types, the following View Options window is displayed.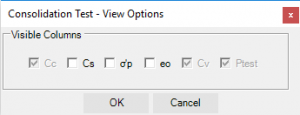
Additional to the standard attributes (Cc, cv, Es, Ptest), the user has the option to add the above shown attributes (Cs, σ’p, eo).
Editing Options
Regarding attributes Cv, Es, Ptest multiple values can be assigned to one depth segment (grid table).
Description
Editing Options
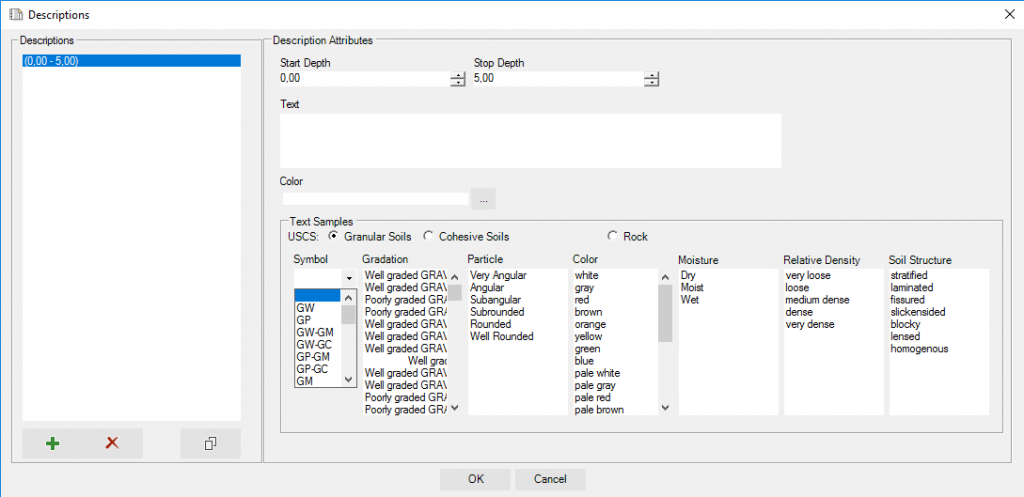
Assigning a description to a depth segment can be achieved by
- Writing the description directly into the Text box
- Using the default Text Samples. Those Text Samples are based onto USCS classification values and refer to Granular/Cohesive Soils and Rock. By double clicking to the default value, it is automatically written into the Text box.
Clue regarding Soil classification – Gradation: There is a filter at the Gradation descriptions, the user can select the Symbol of the soil and as a result the descriptions referring only to the selected category appear.
Discontinuities
View Options
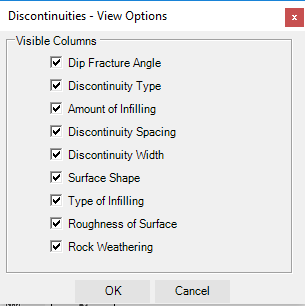
When selecting the Discontinuities column from the column types, the following View Options window is displayed.
All the above sub-columns can be selected to be visible at the log representation.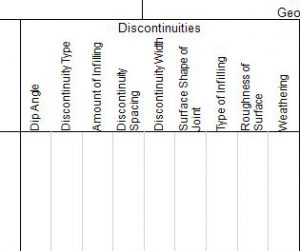
Gradation – Particle Size Analysis
View Options
When selecting the Grain Size Analysis column from the column types, the following View Options window is displayed.
Additionally to the standard attributes (Gravel, Sand), the user has the option to add the Silt-Clay column and/or the Fines column to the log. If Detailed view is selected, the attributes Gravel, Sand (and Silt if selected) are subdivided to Coarse, Medium, Fine values each.
Editing Options
When the user inserts or edits values to the Grain Size Analysis column the following must be clear,
Editing Options box:
- If Detailed View has been selected from View Options, the attributes must by default be assigned in a detailed form (Detailed Values box already marked and cannot be unchecked, unless a different selection derives from View Options window).
- The user can either insert the Grain Size Analysis values using the Material Percentage form or the Passing Percentage form, depending on the data provided. However, no matter the selected form to assign the data, the values shown at the log representation are set to correspond to the material percentage.
Depth Segments box:
- Data can be inserted/edited either by following the basic steps, or by using the grid table (see Atterberg Limits column explanation).
Segment Attributes box:
- The field of Fines attribute is auto calculated (Fines=100% – [Gravel + Sand]) and is not editable.
- Provided that the aggregate of the attributes (Gravel+Sand+Silt+Clay) must be equal to 100%, when such value is not succeeded the warning “Assigned Values are not accurate” appears and the user must revise the values.
Photographic
If photographic data are available, the user can assign the respective image to each depth segment. The options are the following,
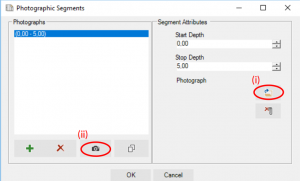
- Assign an image to an already defined depth segment by selecting the Photograph – Browse button.
- Create depth-photo segment by selecting the camera button. The Edit and Import photo segments window appears. The steps to follow are:a. Select the Open Image button, browse and open the imageb. Specify the segment to crop on the photo and select Crop
c. Specify the depth attributes at which the photo segment will be assigned
d. Repeat steps b and c if the specific photo refers to more than one depth segments
e. Close the Edit and Import photo segments window
- Drag n drop a selected list of images directly to the Photographic column at the log. The Start Depth of the pasted images is by default the Stop Depth of the last defined segment. The width of the consecutive depth segments that the images are assigned to, is by default equal to the Step value of Depth column.
Index Properties (Physical Characteristics)
View Options
When selecting the Physical Characteristics column from the column types, the following View Options window pops up.
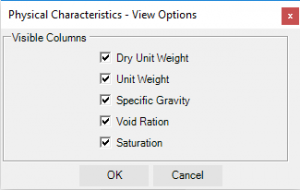 All the above columns can be selected to be visible at the log representation.
Shear Strength Tests
When selecting the Shear Test column from the column types, the following View Options window arises.
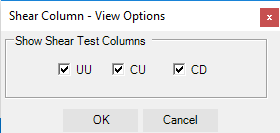
There are three different test types which can be selected to be visible at the log representation (UU, CU, CD).
Standard Penetration Test
Editing Options
Values N1, N2 and N3 are the results derived from Standard Penetration Test. The N-value is auto calculated and it is equal to the sum of N2 and N3. Test Negative
If the Connect Values box is marked a connective line is drawn on the log between two consecutive depth segment values.
Triaxial Shear Strength Tests
View Options
When selecting the Triaxial Test column from the column types, the following View Options window is displayed.
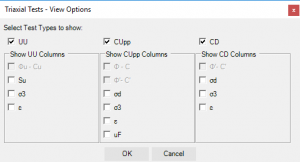
There are three different test types which can be selected to be visible at the log representation (UU, CUpp, CD). Regarding each of these tests, more than one subcolumns can be selected as visible to the log (grey subcolumns are by default shown when the corresponding test type is selected).
Editing Options
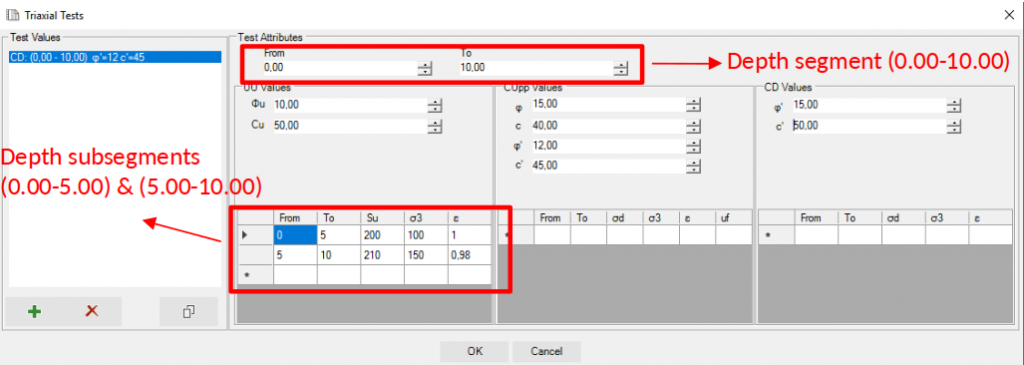
Regarding the default attributes of each test type (UU: Φu, Cu / CUpp: φ, c, φ’, c’ / CD: φ’,c’) one value is assigned at each depth segment.
In case of the additional attributes (UU: Su, σ3, ε / CUpp: σd, σ3, ε, uf / CD: σd, σ3, ε) multiple values can be assigned to each defined depth segment by using the grid table and practically subdividing the depth segment to more individual segments.

